
Rems and Winterbach · River, water, nature and history
What does all this have to do with surfing?
Anyone browsing remswelle.de will find pages about floods and cold air, about the vineyards of 1832, cisterns and bees. On a website promoting a surf wave, that is unusual. This page explains why it belongs together.
We don't just want to build a wave. We want to understand where its water comes from. A river wave lives on the water that the landscape feeds into the Rems. So what matters to us is not only how much rain falls, but what happens to it afterwards. If it runs off within a few hours, the Rems swells briefly – and soon drops again. If the landscape can absorb part of it and release it slowly, there is water in the river for longer.
A wave does not need as much water as possible at once. It needs enough water for as long as possible.
The nice thing is: we do not need to ask for anything special for the wave. What is good for the landscape – soils that hold water, nature and water protection, rediscovered old landscape features such as vineyard walls, field margins and well-kept orchard meadows – also benefits the river. More surfable days are a by-product. → Sustainability

Three reasons why surfers write about soils, streams and bees
1. Water for the wave. The wave only runs when the Rems is within a certain range – on our assumption between 3 and 15 cubic metres per second. Below that there is too little water; above it the installation is lowered for safety reasons. What counts is how many days the river spends between these two limits. And that depends on the landscape. → River flow and surfable days
2. Only in harmony with nature and water protection. There will only be a Remswelle in harmony with nature and water protection – and that is how we want it. That is why we look closely at what lives in and along the Rems and how it is connected: fish and small creatures, wild bees and butterflies, hedges, meadows and woodland edges. → Wildlife of the Rems · → Too many bees?
3. Surfers read landscapes. At the sea we watch wind, currents, tides and waves. On the Rems we watch water, terrain and air. Water flows through valleys – and so, by the way, does cold air. Anyone who wants to use a river should understand its landscape. And what people know and value, they protect. Air and water are more closely linked than one might think: the open meadows, orchard slopes and valley floors over which cool air flows into the village at night are mostly the same areas that absorb rain. Keeping the cold-air corridors open also keeps the sponge areas open – good for cool nights in Winterbach and for the Rems. → Cold air for Winterbach · → Traces in the Hungerberg
How landscape and wave are connected
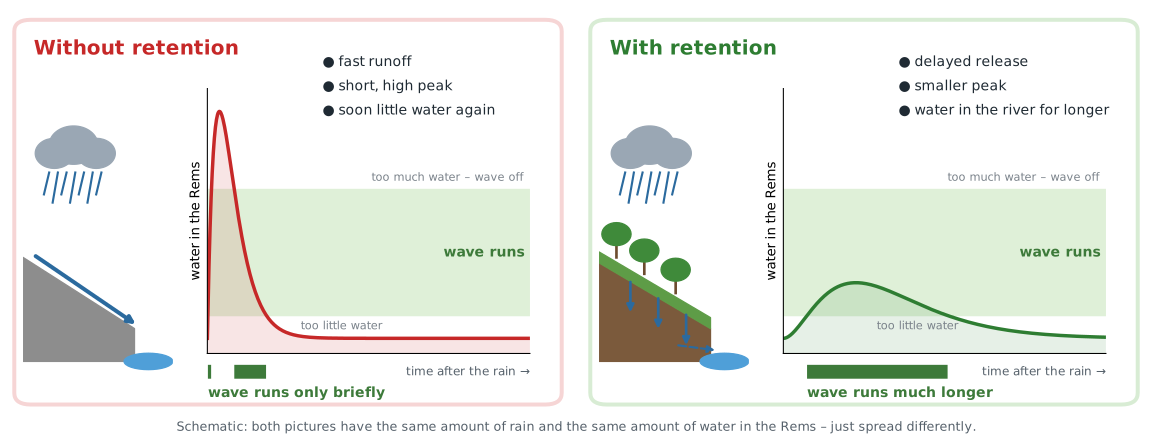
How to read the picture: Both times the same amount of rain falls, and the same amount of water reaches the Rems. On the left it rushes through all at once: first too much for the wave, shortly afterwards already too little. On the right the soil holds the water and releases it slowly. Then the Rems stays longer in the green range in which the wave runs. That is the whole trick.
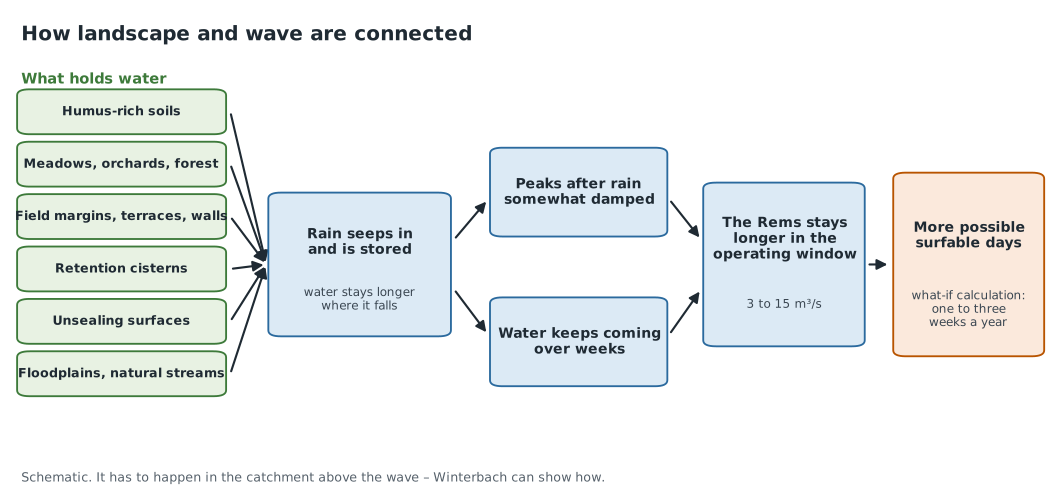
Rain takes two paths to the Rems. The fast path runs over the surface: across compacted or sealed ground, roads, roofs and sewers into the streams. It delivers a lot of water in a short time. The slow path runs through the soil: water seeps in, is held in pores, humus and the root zone, trickles into hillside water and groundwater and re-emerges days or weeks later at springs and in the stream bed. This slow part keeps the Rems alive when it has not rained for a while.
According to our analysis of the Schorndorf gauge record, from 1996 to 2025 a little over half of the Rems water arrived by the fast path and a little under half by the slow one. Every drop that switches from the fast to the slow path moves water from the peak after rain into the days and weeks that follow. That is exactly where the surfable days lie that are narrowly missed today. → Water in Winterbach
The Rems has become flashier
We noticed it while analysing the gauge record: on average the Rems carries as much water today as it did 90 years ago – but it arrives more abruptly. After rain it rises more steeply, and afterwards it falls again more quickly.
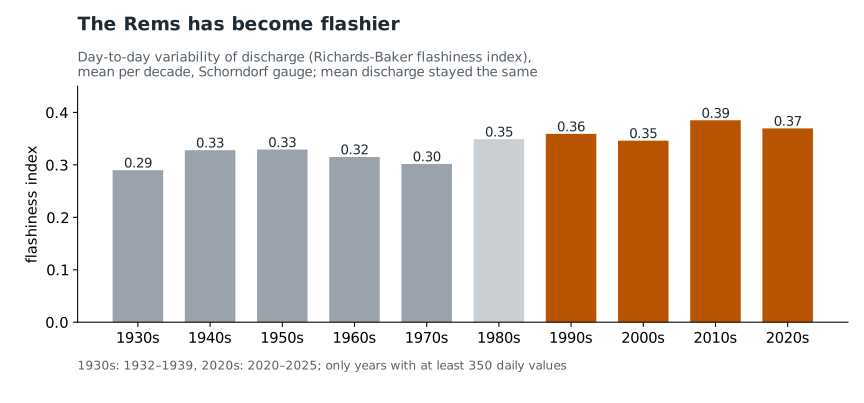
How to read the chart: Each bar shows how strongly the discharge of the Rems varied from day to day in a decade. This is measured with the flashiness index: add up how much the discharge changed each day compared with the day before, and divide by the total amount of water. The higher the value, the flashier the river. Grey are the decades up to 1979, orange the last thirty years.
- From 1931 to 1979 the index averaged 0.31, from 1996 to 2025 0.37 – about 17 per cent higher.
- Mean discharge stayed practically the same: 5.1 and 5.0 cubic metres per second.
- Over all 89 complete years the increase is statistically clear (Mann-Kendall trend test, probability of error below 0.1 per cent). It is not chance.
For the wave this is exactly the wrong direction: more water in short peaks, when the wave has to be lowered, and too little again sooner. What causes it cannot be separated from the gauge record alone. Probably many things act together – heavier rain under climate change, sealed and drained land, straightened streams. The retention basins since 2005 even work in the opposite direction. For us the finding was the reason to deliberately study the history of the landscape: the 1832 cadastral map, old aerial photos, field names and the terrain model. Using Winterbach as an example, they show what the Rems valley used to look like – with meanders, wet meadows and vineyard steps – and where the landscape held water. From this we take ideas for how the Rems can flow more evenly again. → Learning from history
A what-if calculation with our gauge data
How much could that matter? We cannot calculate a forecast. But we can do a what-if calculation. We take the measured daily values of the Rems at Schorndorf from 1996 to 2025 and ask: what if part of the quick runoff had seeped in instead and returned spread over a few weeks? Some of it evaporates on the way; we assume 30 per cent.
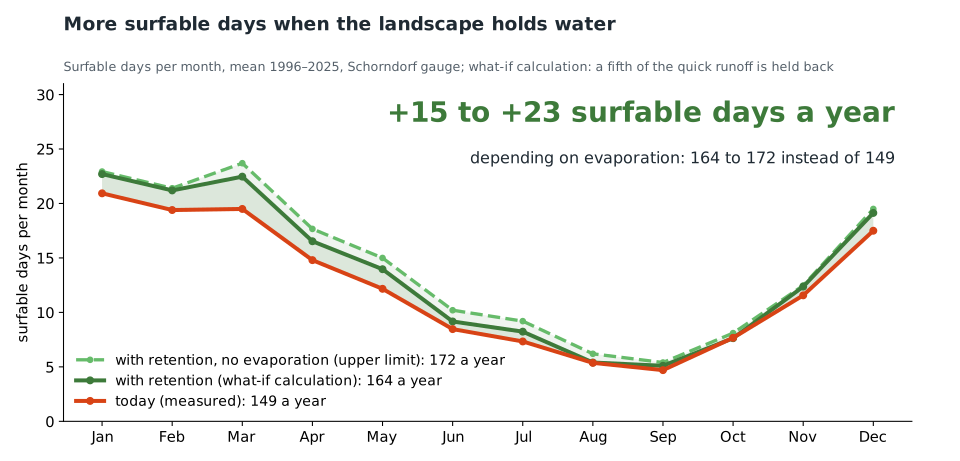
How to read the chart: The red line shows on how many days of a month the wave could run on average today. The green line shows the same if the landscape holds back a fifth of the quick runoff. The green area between them is the surfable days gained – 15 a year in all. The dashed line shows the upper limit if nothing evaporates on the way: then it would be 23.
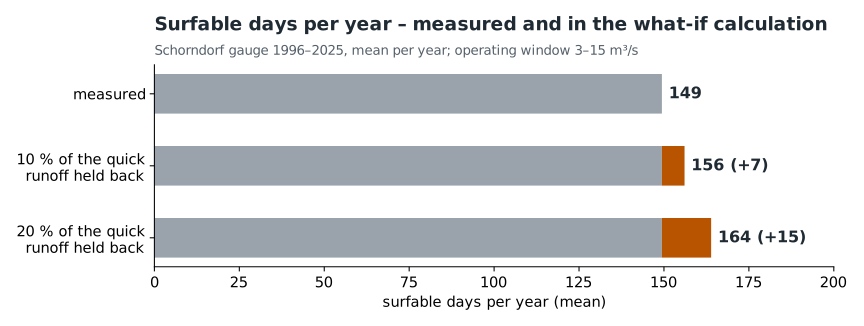
How to read the chart: The grey bar at the top shows on how many days a year the Rems was in the operating window on average from 1996 to 2025: 149 days. Below it, the same Rems in the what-if calculation. The orange part is the gain: about one week if a tenth of the quick runoff stays in the landscape, about two weeks if it is a fifth. Without evaporation it would be 11 and 23 days – that is the upper limit. For a fifth, the gain therefore lies between 15 and 23 surfable days a year, depending on how much water evaporates on the way.
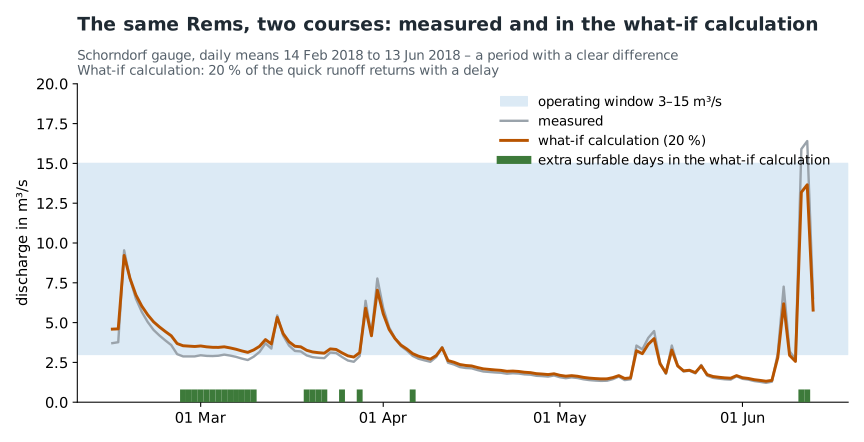
How to read the chart: Grey is what the Rems actually did in spring 2018, orange is the same Rems in the what-if calculation. We chose this period because the difference is easy to see. After each rain the orange line rises a little less and then falls a little more slowly. Where the grey line slips just below 3 m³/s, the orange one stays above it – those are the green days. In mid-June the orange peak stays below 15 m³/s while the grey one rises above it: the wave gains a day there too.
What the calculation shows:
- The gain arises mainly in the days and weeks after rainy spells, when the Rems falls below the lower limit more slowly. Even a good sponge cannot bridge a long dry period.
- Peaks are damped, but not cut off. The highest daily value of the 30 years falls in the calculation from 145 to 131 m³/s (10 per cent) or 118 m³/s (20 per cent). That does not replace flood protection.
- 10 per cent sounds small, but it is a lot. It would mean that across the entire catchment of the Rems above Schorndorf, 418 square kilometres, around 21 litres per square metre more stay in the soil each year. No single village can do that.
A what-if calculation is not a forecast. It shows the direction and the order of magnitude – and that it is worth talking about. How we calculated is explained below. → How we calculated
What holds water – six levers
| Lever | What it does | |
|---|---|---|
| Humus-rich soils | take up rain better and store more of it | Forest or meadow? |
| Meadows, orchards, forest | slow surface runoff; roots open up the soil | Forest or meadow? |
| Field margins, terraces, walls | break the slope into many small steps | Traces in the Hungerberg |
| Retention cisterns | hold back rain from the roof and release it throttled | Sponge landscape |
| Unsealing | lets rain seep in where it falls | Heavy rain in Winterbach |
| Floodplains and natural streams | give high water space and hold it in the area | Restoration in Winterbach |
The soil as a water store
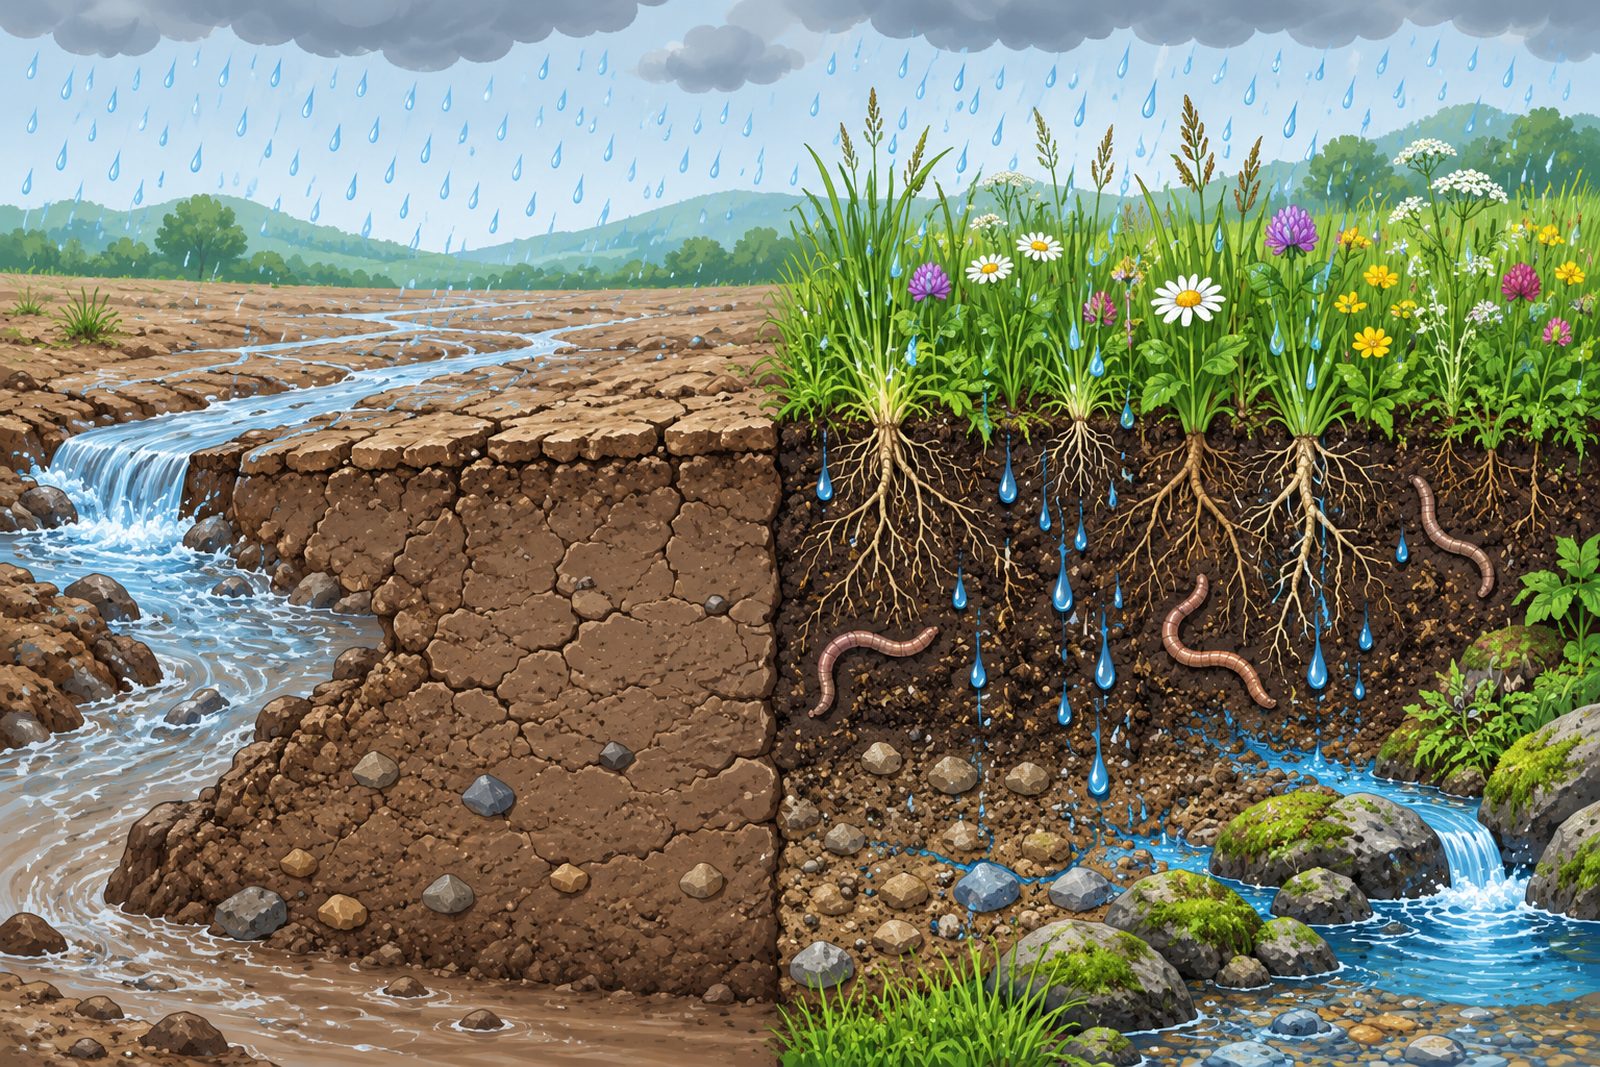
The landscape's largest store is not a basin but the soil. Rain falls on the plant cover, seeps into the topsoil, is held in pores, humus and the root zone, moves into hillside water and groundwater and comes out again at springs and streams. How well that works depends heavily on humus. For vineyard soils, the State Teaching and Research Institute for Viticulture and Pomology in Weinsberg lists, with rising humus content, improved water storage, better water uptake in heavy rain and less unproductive evaporation. Soil that is driven over and compacted loses this ability – and once destroyed, soil cannot be restored, as the Baden-Württemberg Ministry of the Environment points out.
And what about biochar and terra preta?
Terra preta, the "black earth" of the Amazon, is a soil enriched by people over centuries with charcoal, kitchen and plant waste. Today biochar is often recommended for better soils. The German Environment Agency writes that its porous structure and large inner surface allow it to store water and nutrients. The Soil Protection Commission at the German Environment Agency urges caution, however: the effects depend heavily on the source material, statements on the consequences in the soil are contradictory, and the effects on soil life are not yet sufficiently understood. For us that means: an interesting building block, not a solution. The reliable way to more water in the soil remains humus – through plant cover, roots, compost and soil that is not compacted.
Many small steps instead of one fall line
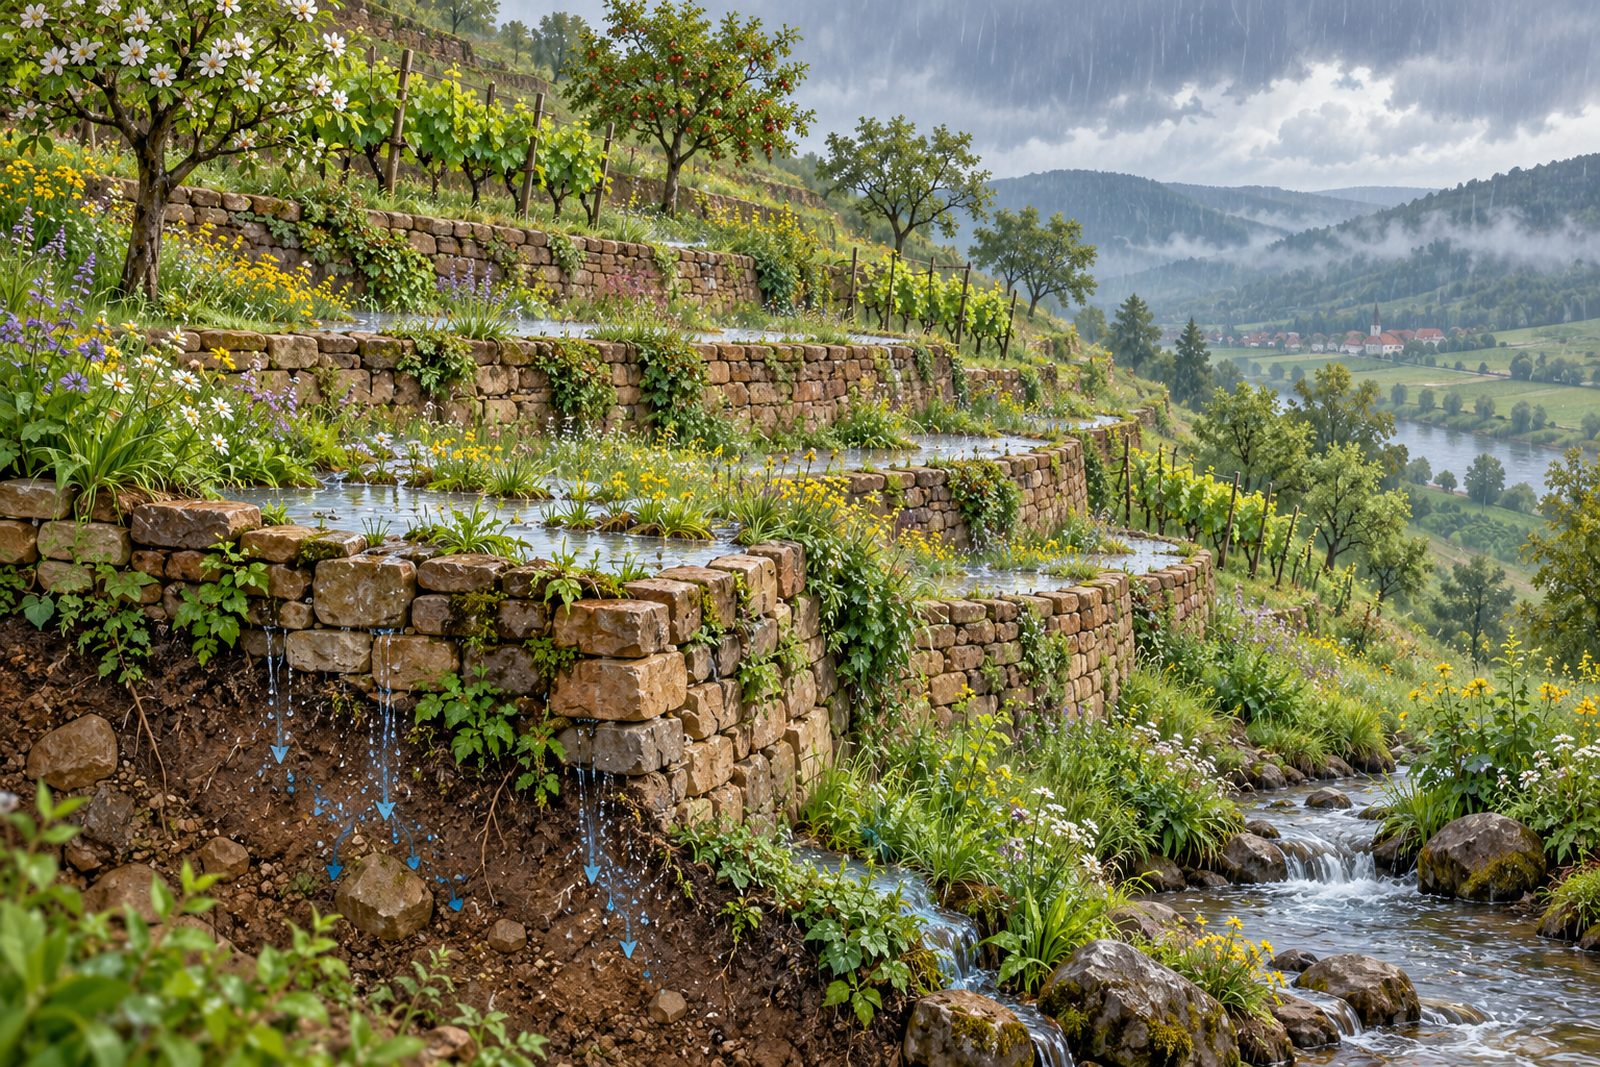
Where forest and meadow stand on the Hungerberg today, there were around 90 hectares of vineyards in 1832. The terrain model still shows their traces: steps, field margins and remains of walls that break the slope into many small sections. Such structures change how quickly water and soil leave a slope. For the vineyards on the Neckar, the Weinsberg institute describes how dressed Keuper sandstones in the dry-stone walls keep the marl from slipping. We do not claim that they measurably change the discharge of the Rems. But the old vineyards show how strongly people used to shape the path of water on the slope.
Should old terraces on the Hungerberg become visible again? The question links history, landscape, biodiversity, viticulture and water. There is no simple answer: dry-stone walls are legally protected as biotopes, and where the slope has long been overgrown, the land may legally have become forest. What can be said without hesitation: walls and field margins that still exist are worth preserving. → Traces in the Hungerberg · → Vineyards of tomorrow
Tending instead of letting it scrub over
It is similar with the orchard meadows. Many plots on the slope are no longer mown regularly today; they become overgrown, and open meadow gradually turns into scrub and woodland. In our observation on the Hungerberg, a mown orchard meadow with dense turf and humus-rich soil is the better sponge. For plots to be looked after, people have to be able to get there – with mower, trailer and ladder. Passable field tracks are therefore not a side issue but a precondition for the slope landscape to stay open and keep its water. Is a field track hard to use? All field tracks are shown in the field-track map. Send us a photo with the location or coordinates to info@remswelle.de. We collect the notes and pass them on together. → Field-track map · → Forest or meadow?
Learning from history
Because the Rems has become flashier, we look at how it and its slopes used to be: on the cadastral map of 1832, in aerial photographs since 1953, in the terrain model. Not because we want to go back to an earlier time, but because the old landscape shows how water, soil and life worked together here before rivers were straightened, streams culverted and slopes put to other uses. This is not a surfers' quirk but common practice: river restoration uses the near-natural state as its guiding image, and the Water Framework Directive measures the state of the fish against a reference: the species that would be expected in a near-natural state. The meanders, floodplains and wet meadows of the old Rems, and the steps, margins and meadows of the old slopes, are clues to where water can be held. → Historic course of the Rems · → Restoration in Winterbach · → Wildlife of the Rems
The Rems valley also has experience with holding water back – only with the opposite aim: for the timber drift it was dammed in flushing ponds and released in one go. We want the landscape to hold water and give it back slowly. → The forgotten wave of Winterbach
Then: drain quickly. Today: also hold back
Between 1958 and 1968 Winterbach was "cleared of floods": a dam in the Lehenbach valley, culverting of the upper Fleckenbach, removal of the old Rems weir, filling-in of the mill canal. The idea behind it was to get the water out of the village as quickly as possible. That made Winterbach safer. Today a second idea is added: holding water where it falls. → Flood protection on the Rems
Both apply to new building areas too. The Riedwiesen on the eastern edge take their name from reeds and marsh ("Ried"); according to the explanatory statement of the development plan, the area used to lie partly within the 100-year flood zone, and its rainwater is now fed into the combined sewer. A sponge becomes a housing estate. We would rather have seen the Riedwiesen built in three phases over several years, the way the Sterrenberg grew in stages: then less soil lies open and is driven over at once, the first phase can teach lessons for the next – and several generations of young people from Winterbach find a building plot in the village. → Winterbach grows
Winterbach alone cannot turn the Rems into a sponge
For the wave, what counts is the water coming from upstream. What seeps in at Winterbach mostly reaches the Rems below the wave site. The levers lie in the catchment above: from Essingen, Mögglingen, Böbingen and Schwäbisch Gmünd via Lorch, Plüderhausen and Urbach to Schorndorf, plus the Wieslauf with Kaisersbach, Welzheim and Rudersberg, the most important tributary for the wave. → Tributaries of the Rems · → Map of the whole Rems
Winterbach alone cannot turn the Rems into a sponge. But Winterbach can show how it's done. The municipalities along the Rems proved long ago that they can work together on flood protection: in the Rems Water Board they built the large retention basins jointly. Holding water in the landscape is the other side of the same task – against floods, against drought and, incidentally, for the wave. We surfers would benefit from it. We say so openly.
More flow for the Rems – what we are planning
For us, "More flow for the Rems" is not a programme of demands but a question we are pursuing: how can the catchment of the Rems hold rain longer, damp peaks and cope better with dry spells?
- Soil: humus, compaction, infiltration – what distinguishes meadow, forest and field
- Slope: meadows, orchards, field margins and terraces on the Hungerberg and in the Schurwald
- Settlement: retention cisterns, unsealing, hollows in the garden
- Water bodies: springs, streams and floodplain
- History: which stores the landscape used to have
- Measuring: gauge, precipitation and our own observations, analysed on this website
What we find out, we write down here – with sources and with a note on where something is proven and where it is not.
Frequently asked questions
What does soil protection have to do with a surf wave?
A river wave does not need as much water as possible at once, but enough water for as long as possible. Soil that absorbs rain and releases it slowly keeps the Rems longer in the range in which the wave can run. In our what-if calculation that means one to three weeks a year.
Do measures in Winterbach help the wave?
Hardly. What seeps in at Winterbach mostly reaches the Rems below the wave site. For the wave, the catchment above counts, from Essingen to Schorndorf and along the Wieslauf. But Winterbach can show what is possible.
How many more surfable days would be possible?
We don't know. Our what-if calculation with the gauge data 1996–2025 gives about 7 extra days a year if a tenth of the quick runoff were held in the landscape, and about 15 for a fifth. Without evaporation it would be 11 and 23. That is an order of magnitude, not a forecast.
Has the Rems really become more restless?
Yes. Mean discharge has stayed the same since the 1930s, but the day-to-day variation has increased: the flashiness index averaged 0.31 in 1931–1979 and 0.37 in 1996–2025, about 17 per cent higher. The trend over 89 years is statistically clear. The causes cannot be separated from the gauge record alone.
Does a sponge landscape protect against floods?
It somewhat damps peaks after rain but does not replace flood protection. The large Rems floods mostly come when the soils are already wet – then the sponge is full too. In the calculation the highest daily value falls from 145 to 131 m³/s.
Is terra preta the solution?
No. Biochar can store water, but its effect depends heavily on the material, and the Soil Protection Commission at the German Environment Agency advises caution. The reliable way is humus through plant cover, roots, compost and soil that is not compacted.
Why does a surf initiative write about nature conservation?
Because there will only be a Remswelle in harmony with nature and water protection – and because that is how we want it. Anyone who wants to use a river must know what lives in it and along it.
More questions and answers about river and landscape: → Questions about the Rems
How we calculated
Data. Daily mean discharge at the state gauge Schorndorf/Rems (431, catchment 418 km²), LUBW: for flashiness 1931 to 2025, for the what-if calculation 1 January 1996 to 31 December 2025. Individual missing days are filled with the previous day's value.
Flashiness. For each calendar year from 1932 to 2025 with at least 350 daily values (89 years) we calculate the Richards-Baker flashiness index (Baker et al. 2004): the sum of the absolute day-to-day changes in discharge divided by the sum of all daily discharges. We test the trend with the Mann-Kendall test (Kendall's tau 0.34, p = 0.000002). Values per year: rems-sprunghaftigkeit.csv (opens in a new tab), key figures: rems-sprunghaftigkeit.json (opens in a new tab).
Quick and slow runoff. We split the daily values into a quick and a slow component with the digital filter of Lyne and Hollick (1979), using the usual parameter 0.925 and three passes (Nathan and McMahon 1990). Result: about 44 per cent slow runoff.
What-if calculation. A share of the quick runoff (10 or 20 per cent) does not drain at once but passes through an additional store that releases one thirtieth of its content each day (mean residence time 30 days). 30 per cent of the stored water is lost to evaporation. A surfable day is a day with a daily mean of 3 to 15 m³/s, as on the river-flow page.
Which area. The what-if calculation applies to the entire catchment of the Schorndorf gauge: the Rems from its source near Essingen down to Schorndorf with all side valleys, including the Wieslauf, 418 square kilometres in total. Between the gauge and the wave site only a little more area is added. If only part of the catchment held that much water, the gain would be smaller in roughly the same proportion – the Wieslauf alone (77 square kilometres, just under a fifth) would bring about a fifth of it.
What the calculation cannot do. It does not say where and how the water is held, and it treats the whole catchment alike. Residence time and evaporation are assumptions; other values change the result in size, not in direction. Daily means smooth out short flood waves.
Terms. Discharge, gauge, operating window and more are explained in the glossary; how a river wave works is covered under Knowledge.
Recalculate. Results per year: mehr-flow-rechenspiel.csv (opens in a new tab), key figures: mehr-flow-rechenspiel.json (opens in a new tab) (German column names). Errors or better assumptions please to info@remswelle.de.
Sources: LUBW, Schorndorf/Rems gauge (431), daily mean discharge, own analysis · Lyne, V. and Hollick, M. (1979): Stochastic time-variable rainfall-runoff modelling. Institute of Engineers Australia, Hydrology and Water Resources Symposium · Baker, D. B., Richards, R. P., Loftus, T. T. and Kramer, J. W. (2004): A new flashiness index: characteristics and applications to midwestern rivers and streams. Journal of the American Water Resources Association 40(2) · Nathan, R. J. and McMahon, T. A. (1990): Evaluation of automated techniques for base flow and recession analyses. Water Resources Research 26(7) · LVWO Weinsberg, "Vorsicht bei der Phosphatdüngung – Humuszufuhr auch langfristig ermöglichen!" (May 2018) and "Trollinger, Trockenmauern und mehr" · Baden-Württemberg Ministry of the Environment, "Bodenschutz beim Bauen" · German Environment Agency, "Pflanzenkohle möglichst umweltfreundlich kaufen oder herstellen" · Soil Protection Commission at the German Environment Agency, "Boden als Kohlenstoffspeicher" (December 2024) · Heimatverein Winterbach, local films 1958–1968 (24 Nov 2019) · Municipality of Winterbach, explanatory statement on the "Riedwiesen" development plan (2021) · Rems Water Board, history · Images "The soil as a water store" and "Many small steps": AI-generated visualisations
Last updated: 15 October 2026 · Initiative Remswelle