
Rems and Winterbach · River, water, nature and history
Flow of the Rems: how many days a year would a wave be surfable?
The first question from every authority and every hydraulic engineer is: is there enough water? For a river wave that does not mean "on average" but "on how many days a year". We have analysed the daily values of the Schorndorf state gauge over more than ninety years and show here what follows from them – as a first rough estimate by the initiative from public data, not as a statement on feasibility. The calculation is laid open, the data are available for download, and anyone who wants to check them can do so.
Today: 0.63 m³/s (daily mean 24 Sep 2026) – very little water for late September (typical 1.68 m³/s). The Rems today →
The key figures
Specialists speak of discharge: the amount of water that flows through the river every second, measured in cubic metres per second (m³/s). So it does not mean a watercourse branching off from the Rems – that would be a diversion – but simply how much water the Rems is carrying at the moment.
The Schorndorf state gauge (number 431) lies a few kilometres upstream of Winterbach; there are no significant tributaries in between, so the values are transferable. The State Institute for the Environment Baden-Württemberg (LUBW) provides its daily means since 1 November 1931. For the 89 complete years from 1932 to 2025 the result is:
| Key figure | 1932–2025 | 1996–2025 | 2016–2025 |
|---|---|---|---|
| Mean discharge (MQ) | 5.15 m³/s | 5.02 m³/s | 4.38 m³/s |
| Mean low-water discharge (MNQ) | 0.94 m³/s | 0.95 m³/s | 0.80 m³/s |
| Mean flood discharge (MHQ) | 69 m³/s | 70 m³/s | 64 m³/s |
| Median (not reached on half of all days) | 3.07 m³/s | 2.76 m³/s | 2.34 m³/s |
Two things stand out. First, the median is well below the mean: on most days the Rems carries less water than the mean suggests, because a few flood days lift the average. Second, all key figures have fallen in the last decade. Both are decisive for a wave.
For context: the Almkanal wave in Salzburg runs on a constant roughly 5 m³/s in a regulated canal, the waves in Nuremberg and Pforzheim are on rivers and canals of a similar order of magnitude, and in Thun the natural waves need 120 to 150 m³/s. The amount of water in the Rems is therefore in the league in which river waves are built – the difference is that it fluctuates. → Wave types and technology
The flow duration curve
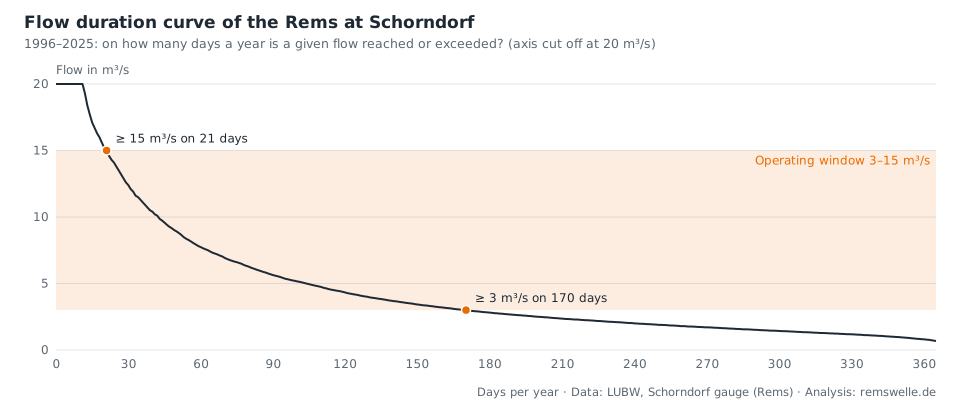
A flow duration curve answers the question "on how many days a year is a given discharge reached or exceeded?". You sort all daily values of a long period by size and read off the result. For 1996 to 2025:
| Reached or exceeded on … days a year | Discharge |
|---|---|
| 30 | 12.4 m³/s |
| 60 | 7.7 m³/s |
| 90 | 5.6 m³/s |
| 120 | 4.3 m³/s |
| 150 | 3.4 m³/s |
| 180 | 2.8 m³/s |
| 240 | 2.0 m³/s |
| 300 | 1.4 m³/s |
| 355 | 0.9 m³/s |
The Rems carries more than 3 m³/s on around 170 days a year, more than 4 on 129 and more than 5 on 104 days. It is above 15 m³/s on only 21 days, above 20 on 11.
The operating window – and why it decides everything
A built wave does not run at every discharge. At the lower end, the amount of water sets the limit: too little water gives only a thin film on the ramp, not a wave you can stand on. At the upper end, safety sets the limit: during a flood an adjustable installation is lowered and operation is stopped. In between lies the operating window, and exactly where its limits are depends on the design, the width and the head – that is the core question of the feasibility assessment. → Hydraulics
We calculate with two assumptions to show the range: a window of 3 to 15 m³/s as the main assumption and a window of 2 to 12 m³/s for an installation that manages with less water. The lower limit is the sensitive one: between 3 and 2 m³/s there are around 60 days a year. Any design that keeps the wave standing at a lower discharge gains a disproportionate number of surf days – which is exactly why Pforzheim is rebuilding its wave in 2026.
What impoundment and adjustability bring
Two levers are often mentioned to gain more surf days – and they work very differently. Impounding does not change the amount of water, only the height. The impoundment provides the head the wave needs so that the water at the foot of the ramp becomes fast enough. At the Winterbach outlet structure the Rems currently flows straight through; the structure narrows the river and can impound it – to what extent head for a wave can be gained from it is for the feasibility study to establish. It does not bring additional days: at 0.6 m³/s, the same 0.6 m³/s comes over the ramp after the impoundment. An adjustable wave floor works differently. It adapts the ramp to the discharge so that the wave keeps its shape across the whole window, and at low water it can narrow the outlet so that the same amount gives a higher wave on a narrower width. What a wave needs at low water is a minimum amount per metre of width; if you take half a cubic metre per second and metre as a rough lower limit, a 6 metre wide wave needs 3 m³/s, a 4 metre wide one 2 m³/s, a 3 metre wide one 1.5 m³/s – and according to the flow duration curve that is 170, 241 and 292 days a year. The price is a narrow wave for one person at low water. Below about 1 m³/s, as in late summer of dry years, there is no wave, however narrow; then operation pauses, as all river waves know it. What this back-of-the-envelope calculation does not replace is the hydraulic modelling of the feasibility assessment.
Surfable days per year
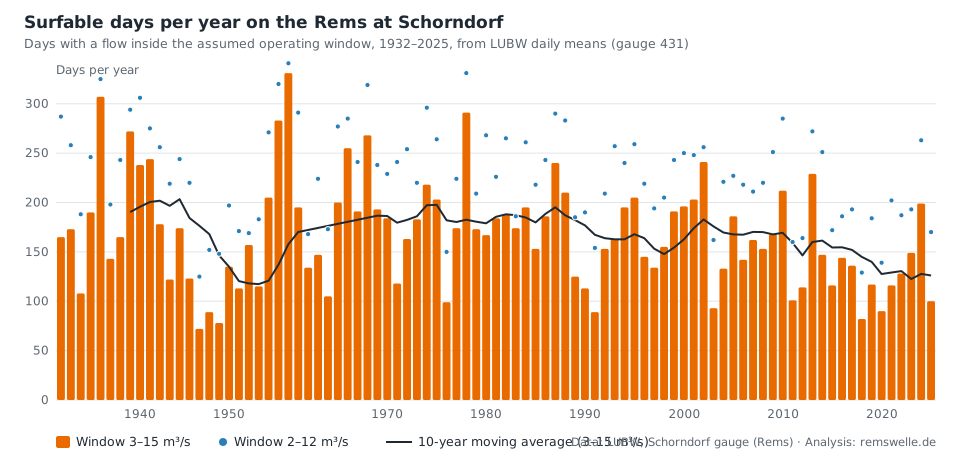
On average over the years 1996 to 2025, the discharge lay within the 3 to 15 m³/s window on 149 days a year (worst year 82, best 241) and within the 2 to 12 m³/s window on 209 days (129 to 285). For comparison: Bern has set a target of around 100 surf days a year for its wave project. → Feasibility study
But the long series also shows a trend that we do not hide: from the 1950s to the 1980s the number of days in the main window was 180 to 195 a year, in the 2000s 168, in the 2010s 140, in the 2020s so far 123. The year 2026 is, with 46 days up to the end of September, a downward outlier – a dry year in which the Rems has flowed below one cubic metre per second since August. The Rems is getting drier, and a wave that is planned today has to reckon with the years after 2015, not with the long-term mean.
Surfable days per month
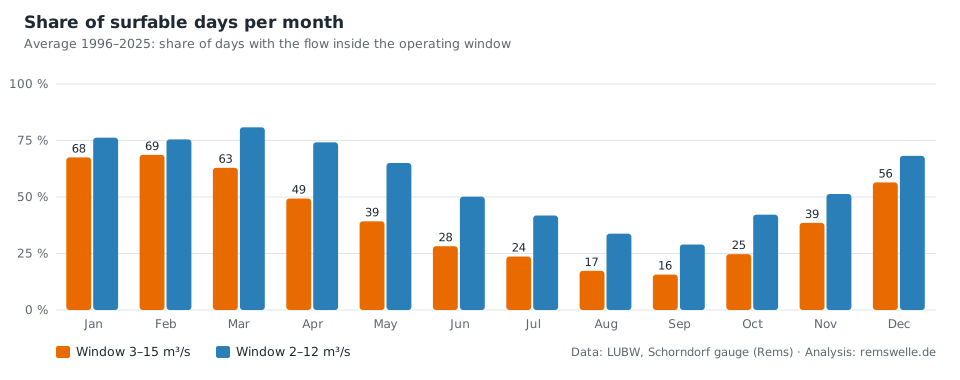
The distribution over the year is the real news. From December to March the discharge lies in the main window on two thirds of the days, in April on half. From June to September it is only 16 to 28 per cent – in August and September about five days a month. The Rems carries the most water in winter and the least in late summer, when it is holiday time and swimming weather. That is not a special case of Winterbach but the rule for rivers without glacier or snow storage: Pforzheim knows the same summer gap. For the planning this means: a Remswelle would be a winter and spring wave with a wetsuit, just as people surf all year round in Nuremberg and Hanover, and the summer months would depend on how far down the window reaches.
How the surfable days fit together with wind, air and water temperature and the right wetsuit over the year is shown in our wind and climate calendar. → Wind and weather in Winterbach
Big Days: when the Rems really runs
Anyone who surfs in the sea knows the term: a Big Day is the day when the swell arrives big enough for the spots to show their best – and one swell too many, and they are "closed out", the waves break unrideably all at once. At the sea, three things decide surfability: the swell, the state of the tide and the wind. In a river, almost only one thing decides – the water level, that is, the discharge. So the counterpart to the Big Day exists here too, except that it is not the swell that makes the day but the water the river happens to be carrying. Within the operating window a river wave is not always the same: with more water it becomes higher, steeper and more powerful, until the point comes at which the installation is lowered for safety reasons. The Big Day of a river wave is the day at the upper edge of the window – as much water as the installation can just about take. It has nothing to do with big-wave surfing in Nazaré; it is not about height but about pressure and shape. Surfers say: "It's pumping" – or, when everything comes together: "It's firing."
We therefore divide our main window into three levels, again as an assumption, not a measured value: 3 to 6 m³/s a small wave, on which you learn and practise; 6 to 10 m³/s running, the wave has power; 10 to 15 m³/s Big Day, the wave stands at the upper edge. Above 15 m³/s it is a flood, the installation would be lowered – closed out. Where these levels really lie for the built wave is for the feasibility assessment to say; the pattern the data show is unaffected by that.
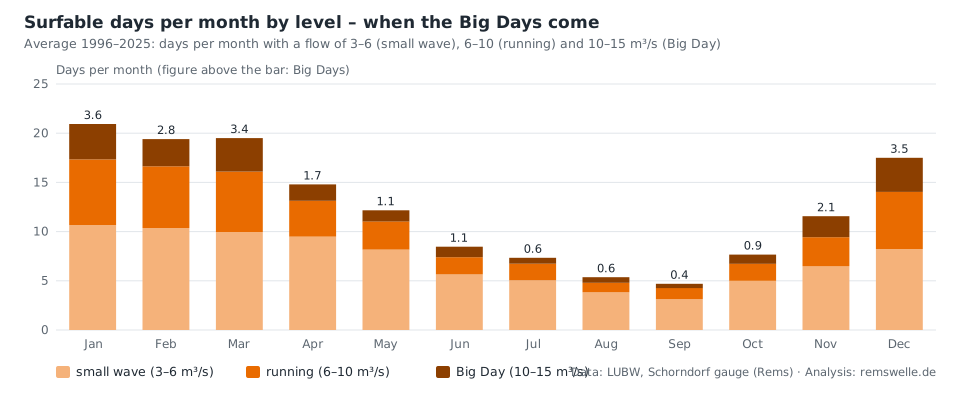
The pattern is clear. On average over the years 1996 to 2025 there were 22 Big Days a year on the Rems (worst year 10, best 51), plus around 42 days on which it is "running" and 86 days of small wave. Ten of the 22 Big Days fall in winter, six in spring, only two in summer. January is the month with the most Big Days, September the one with the fewest. And they almost always come in the same way: in half of the cases the Big Day is the day on which a flood recedes and the discharge falls through the window from above – the counterpart to the day after the storm at sea, when the swell is still there but clean. After that, in two out of three cases, a phase follows in which the wave is still "running" for days. If, on the other hand, the Big Day comes from below, after heavy rain or snowmelt, then it comes fast: the discharge typically jumps by 8 m³/s in one day, and in every third of these cases it runs beyond the window the next day. Big Days are short: two out of three last exactly one day, longer phases of three days and more occur only in every tenth event, and the longest in thirty years lasted six days. Anyone who wants to catch them has to read the forecast.
Here too the trend: in the years 2016 to 2025 there were on average only 17 Big Days a year. Up to the end of September, 2026 has brought 5 Big Days and 7 "running" days – out of a total of 46 surfable days. In other words: even in a dry year, the Rems would have carried a wave on 46 days up to autumn, and on twelve of them one with power. It is just that no wave was there.
How a Big Day could be forecast
For the sea coast there is the swell forecast; for the Rems it can be built. The Flood Forecasting Centre Baden-Württemberg (HVZ) shows the Schorndorf gauge continuously and publishes forecasts for gauges derived from the precipitation forecasts. For a lead time of hours, the river itself is enough: a flood wave takes around 30 river kilometres from the Schwäbisch Gmünd gauge to Winterbach, that is about five to eight hours, and around one hour from the Schorndorf gauge. If Gmünd rises above 10 m³/s in the morning, Winterbach's turn comes in the evening. The exact travel time could be determined by comparing the gauge series for a few floods. Together with the weather forecast this gives a three-day preview in our levels – not enough water, small wave, running, Big Day, flood. We are working on showing it on the home page, together with the number that interests us most: on how many days this year the Remswelle would already have run.
Low water: when the Rems almost dries up
At the other end is summer. In dry years the Rems falls so low that the authorities intervene: the Rems-Murr-Kreis and Ostalbkreis districts banned taking water from rivers and streams in 2022, 2025 and 2026. The Rems-Murr-Kreis general order of 2026 applies until 30 September; it is justified by rising water temperature and lack of oxygen, which can become a threat to fish. In the Ostalbkreis in 2025 the rule was that below 0.40 m³/s at the Schwäbisch Gmünd gauge no water at all may be taken. In August 2026 the Rems and the Lauter near Mögglingen dried up except for remaining puddles; the fire brigade pumped in about 250,000 litres of drinking water to save the fish. On 11 August 2026 the district office (Landratsamt) asked people not to walk in the Rems and streams at low water, to spare the stressed animals.
For the wave this means: in late summer it stands still, and that is as it should be. A surf wave must not take water from the river in dry periods and must not put the fish under additional stress. → Wildlife and plants on the Rems
The Rems has become flashier
On average the Rems carries as much water today as in the 1930s, but it arrives more abruptly: after rain it rises more steeply and then falls again more quickly.
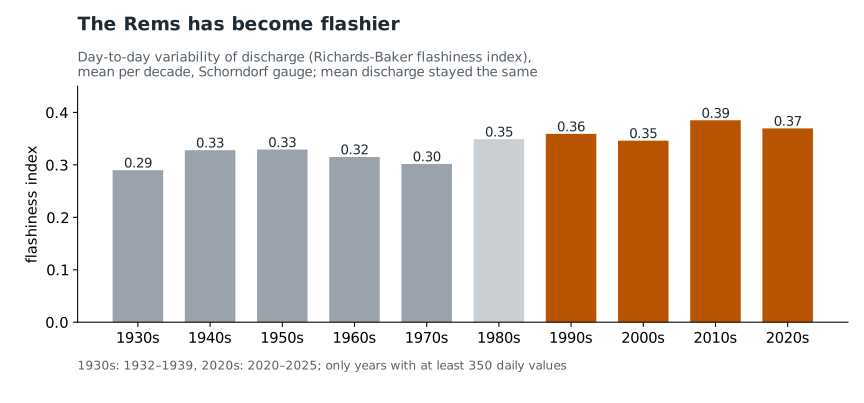
How to read the chart: Each bar shows how strongly the discharge varied from day to day in a decade (flashiness index: sum of all daily changes divided by the total amount of water). From 1931 to 1979 the value averaged 0.31, from 1996 to 2025 0.37 – about 17 per cent higher, with practically the same mean discharge (5.1 and 5.0 m³/s). The trend over 89 years is statistically clear.
For the wave this is the wrong direction: more water in short peaks, when it has to be lowered, and too little again sooner. That is why we deliberately study the history of the landscape – the 1832 cadastral map, old aerial photos, field names and the terrain model. They show where the landscape used to hold water: meanders, floodplains, wet meadows, vineyard steps. From this we want to learn how the Rems can flow more evenly again. → What does all this have to do with surfing? · → Historic course of the Rems
What this means for the Remswelle
The figures do not speak against a wave, they say which wave: an adjustable installation that uses the discharge between two and twelve cubic metres, creating the necessary head at the existing structure. The feasibility assessment has to clarify from which discharge a surfable wave actually stands at the Winterbach outlet structure – only then does our assumption become a reliable number. Until then: in the order of 150 to 200 days a year, concentrated from October to May and with a gap in high summer. → Winterbach site
How we calculated
Data. Daily means of discharge at the Schorndorf/Rems state gauge (station number 431, catchment area 418 km²), 1 November 1931 to 24 September 2026, from the LUBW data and map service; 33,235 valid values, gaps mainly in 1945. For plausibility checking, the second gauge Schorndorf-Bauhof (76124, since 2012): on 4,033 common days both series agree in the median (ratio 1.00).
Key figures. MQ is the mean of all daily values, MNQ the mean of the annual minima, MHQ the mean of the annual maxima, each only from years with at least 350 daily values. The flow duration curve is the series 1996–2025 sorted in descending order, converted to 365 days.
Levels and Big Days. Within the main window we count days with 3 to 6 m³/s as small wave, 6 to 10 as "running" and 10 to 15 as Big Day. A Big Day phase is a run of consecutive days at this level; "before" and "after" is the level of the day immediately before and after the phase, evaluated for 1996–2025 (437 phases). The limits are assumptions that the feasibility assessment will replace.
Surf days. A day counts as surfable if its daily mean lies within the operating window; years with gaps are extrapolated to 365 days. The windows are assumptions: the lower limit is based on the experience that built waves on small rivers and canals run on a few cubic metres per second, the upper one on the fact that adjustable installations are lowered during floods. The feasibility assessment will replace both limits with the values of the actual installation.
Flashiness. Richards-Baker flashiness index (Baker et al. 2004) per calendar year with at least 350 daily values, 1932–2025 (89 years): sum of the absolute day-to-day changes divided by the sum of all daily discharges. Mann-Kendall trend test: tau 0.34, p = 0.000002. Values per year: rems-sprunghaftigkeit.csv (opens in a new tab).
What the calculation cannot do. It says nothing about what the wave looks like at a given discharge – that needs the cross-section, the head and a hydraulic model. Daily means also smooth out short rain-driven surges; on individual days the discharge can run out of the window within hours. And the gauge measures upstream of the weir, not in the weir; diversions or controls at the weir itself are not included.
Check it yourself. The daily means of the Schorndorf gauge (431) are available directly from the LUBW in the data and map service (opens in a new tab) under "Landespegel Hydrologie". Our analysis is available as text files: the surf days per year (surftage-je-jahr.csv (opens in a new tab)), the Big Days per year (big-days-je-jahr.csv (opens in a new tab)) and the flow duration curve (dauerlinie-1996-2025.csv (opens in a new tab)). Anyone who considers a different window assumption to be correct can recalculate it with these in a few minutes. Errors or better assumptions please to info@remswelle.de.
Frequently asked questions
On how many days a year would the Remswelle be surfable?
According to our first estimate from 30 years of gauge data, on around 150 days if the installation runs between 3 and 15 m³/s, and on around 210 days if it already forms a wave from 2 m³/s. The actual limits will be set by the feasibility assessment.
Why is there so little water in the Rems in summer?
The Rems has no snow or glacier water in its catchment; it lives on rain and groundwater. In late summer the reserves are empty, and in August and September less than 1 m³/s flows on many days. That is the case for all rivers of this kind – Pforzheim has the same problem.
Where do the figures come from?
From the publicly accessible daily means of the LUBW for the Schorndorf gauge, 1931 to today, checked against the Schorndorf-Bauhof gauge. The analysis is available on this page for recalculation; the daily means themselves are in the LUBW data and map service.
What is a Big Day on the Rems?
A day at the upper edge of the operating window, by our assumption 10 to 15 m³/s: the wave higher and more powerful, but still safe. On average there were 22 of them a year, mostly in winter and mostly on the day a flood recedes. Above that the installation would be lowered – like a spot in the sea when the swell is too big.
Can't you simply impound the water?
A weir raises the water level, not the amount of water. The impoundment provides the head the wave needs, but at 0.6 m³/s there is not enough water to carry a wave even with impoundment.
Sources: Baker, D. B., Richards, R. P., Loftus, T. T. and Kramer, J. W. (2004): A new flashiness index. Journal of the American Water Resources Association 40(2) · Landratsamt Rems-Murr-Kreis (district office), general order on water abstraction 2026 and notice of 11.08.2026 · Ostalbkreis, general order 2025 · Zeitungsverlag Waiblingen, 19.08.2026 (Mögglingen) · Flood Forecasting Centre Baden-Württemberg (HVZ), gauges Schorndorf/Rems and Schwäbisch Gmünd/Rems · State Institute for the Environment Baden-Württemberg (LUBW), data and map service, Landespegel Hydrologie: gauges Schorndorf/Rems (431) and Schorndorf-Bauhof/Rems (76124), discharge daily means, retrieved 24 September 2026 · Deutsches Gewässerkundliches Jahrbuch (German Hydrological Yearbook), Rheingebiet Teil I (catchment of the Schorndorf gauge) · City of Salzburg, „Almkanal“ (discharge of the Almkanal wave) · Verein Flusssurfen Thun (discharge range) · blackforestwave e.V., rebuild 2026 · Flusswelle Bern, „Projekt“ (surf days target)
Last updated: 15 October 2026 · Initiative Remswelle