
Rems and Winterbach · River, water, nature and history
The Rems in figures
On average a good 5 cubic metres of water per second flow in the Rems at Schorndorf – but on a typical day only about 3, because a few flood days pull the average up. In January the Rems carries a good three times as much water as in September. The largest flood since measurements began brought a daily mean of 230 m³/s on 3 March 1956; the lowest daily mean so far was 0.12 m³/s on 30 June 1952. We analysed these figures ourselves from about 33,000 daily values of the Schorndorf gauge from November 1931 to September 2026 – the basis for everything we say about water for a wave.
Today: 0.63 m³/s (daily mean 24 Sep 2026) – very little water for late September (typical 1.68 m³/s). The Rems today →
The data basis
The Schorndorf gauge on the Rems (LUBW number 431) lies just under two kilometres above the "Remswehr" (as it is called locally) and measures the discharge from a catchment of 418 square kilometres. The State Institute for the Environment Baden-Württemberg (LUBW) has published its daily means since 1931. Some years are incomplete; in comparisons between years we only include years with at least 350 daily values. The most recent values are unverified raw data. → Flow of the Rems
Mean and typical day
| Key figure | Value |
|---|---|
| Mean discharge (MQ) over all years | 5.15 m³/s |
| Median (typical day) | 3.07 m³/s |
| Mean low-water discharge (MNQ) 1996–2025 | 0.95 m³/s |
| Mean annual flood (daily mean) 1996–2025 | 70 m³/s |
| Highest daily mean | 230 m³/s (3 March 1956) |
| Lowest daily mean | 0.12 m³/s (30 June 1952) |
The mean and the typical day are far apart. That is normal for a river like the Rems: on a few days a year it carries many times its usual amount of water, and these days help determine the average. For a wave, therefore, what matters is not the mean but on how many days the water is within the usable range. → Surfable days
The Rems through the year
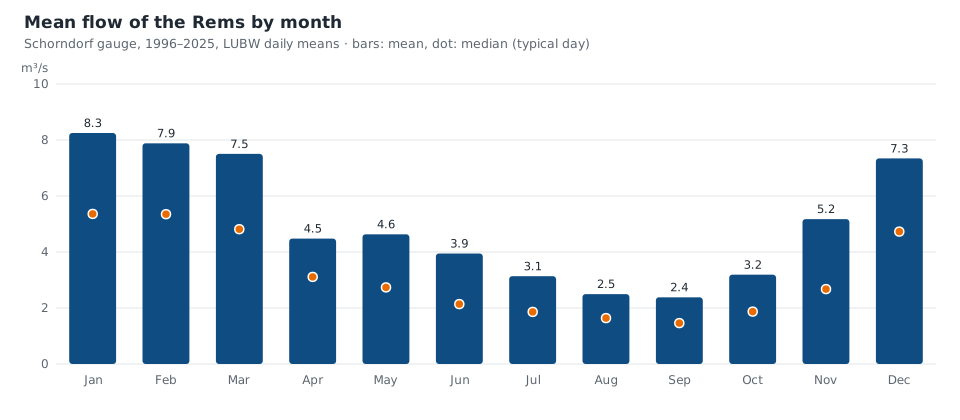
The Rems is a winter river. From December to March it carries 7 to 8 m³/s on average, with a typical day at about 5. From April the water declines; in August and September the mean is only 2.4 to 2.5 m³/s, a typical day about 1.5. The reason: the Rems has no snow or glacier meltwater in its catchment; it lives on rain and groundwater. In summer a lot evaporates, and plants need the water themselves.
The largest floods since 1931
| Date | Daily mean at the Schorndorf gauge |
|---|---|
| 3 March 1956 | 230 m³/s |
| 13 April 1994 | 171 m³/s |
| 22 February 1970 | 147 m³/s |
| 29 October 1998 | 145 m³/s |
| 4 February 1935 | 138 m³/s |
| 29 December 1947 | 138 m³/s |
| 15 February 1990 | 132 m³/s |
| 1 June 2024 | 130 m³/s |
| 21 March 2002 | 128 m³/s |
| 13 January 2011 | 128 m³/s |
The values are daily means; the peak of a flood is considerably higher for a few hours. Most large floods occur in winter and spring, when rain falls on saturated ground or melting snow. The June 2024 flood is the most recent among the ten largest – and one of the few in summer. The February 1990 flood was the reason for founding the Rems Water Board (Wasserverband Rems). → Flood protection on the Rems
Low water: the dry years
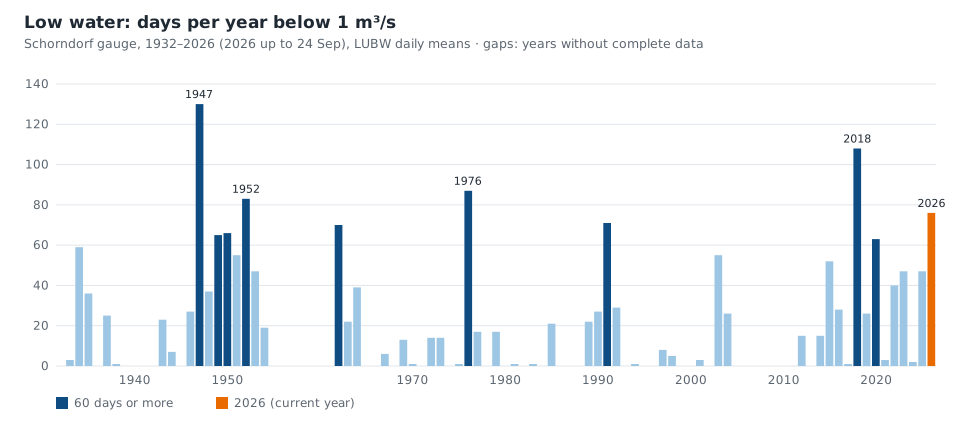
Below 1 m³/s the Rems becomes a trickle. In most years this happened on only a few days – but in some years for months: in 1947 on 130 days, in 2018 on 108, in 1976 on 87 and in 1952 on 83. The driest years in terms of annual mean were 1949 (2.3 m³/s), 1934 and 1976. In 2026 the Rems had already been below 1 m³/s on 76 days by the end of September; the Rems-Murr-Kreis and Ostalbkreis districts had banned taking water from rivers and streams, and near Mögglingen the Rems ran dry in August.
Comparing periods, the number of such days averaged 27 per year from 1932 to 1961, 15 from 1962 to 1991 and 18 from 1996 to 2025. The data show no steady trend – but they do show that since 2015 there have been strikingly many years with long low-water periods: 2015, 2018, 2020, 2022, 2023, 2025 and 2026, each with 40 days or more.
Has the Rems changed?
| Period | MQ | MNQ | Days below 1 m³/s per year | Days above 30 m³/s per year |
|---|---|---|---|---|
| 1932–1961 | 5.01 m³/s | 0.82 m³/s | 27 | 5.0 |
| 1962–1991 | 5.42 m³/s | 1.01 m³/s | 15 | 5.2 |
| 1996–2025 | 5.02 m³/s | 0.95 m³/s | 18 | 4.4 |
Over 95 years the mean discharge of the Rems has remained remarkably stable. The differences between the periods are smaller than the fluctuations from year to year: the wettest year, 2002, brought a mean of 8.8 m³/s, the driest, 1949, only 2.3. Whether the dry summers of recent years are the beginning of a change cannot be said from one gauge alone – that requires longer series and the state's own analyses.
What this means for the Remswelle
The figures show why a wave on the Rems would above all be a wave for autumn, winter and spring. From December to April a typical day lies in the range we consider surfable; in late summer and early autumn it is mostly below – then the surfable days come mainly after rain. And they show that a wave must be out of operation during floods – the ten largest floods since 1931 were all above 120 m³/s as a daily mean. → Flow of the Rems · → The Winterbach site
The data to download
The annual values of our analysis – mean, lowest and highest daily discharge and the number of days below 1 and above 30 m³/s for each complete year – are available as a CSV file so you can recalculate them: rems-jahreswerte.csv (opens in a new tab). The daily values themselves are provided by the LUBW in its data and map service. The file contains only our own calculations, no raw data from the LUBW. It is free to use – for teaching, club work or your own analyses – with the attribution "Based on: LUBW, Schorndorf/Rems gauge; analysis by the Remswelle initiative".
Frequently asked questions
How much water does the Rems carry?
At the Schorndorf gauge 5.15 m³/s on average, about 3 m³/s on a typical day. In January the mean is a good 8, in September just under 2.4 m³/s.
What was the largest flood on the Rems?
Since measurements began in 1931, the flood of 3 March 1956 with a daily mean of 230 m³/s at the Schorndorf gauge. Among the ten largest, the most recent is that of 1 June 2024 with 130 m³/s.
When does the Rems carry the least water?
In August and September. In dry years such as 1947, 2018 or 2026 it was below 1 m³/s on 76 to 130 days.
Is the Rems getting drier?
The mean discharge has remained almost the same over 95 years. However, recent years have had strikingly many dry summers; whether this is a trend cannot be said with certainty from one gauge alone.
Sources: State Institute for the Environment Baden-Württemberg (LUBW), data and map service, Schorndorf/Rems gauge (431), daily mean discharges 1931–2026, accessed 24.09.2026, most recent values unverified · Deutsches Gewässerkundliches Jahrbuch, Rheingebiet Teil I (catchment) · Landratsamt Rems-Murr-Kreis (district office), general order on water abstraction 2026 · Zeitungsverlag Waiblingen, 19.08.2026 (Mögglingen) · Wasserverband Rems, "Geschichte des Verbands" · Analysis by the Remswelle initiative
Last updated: 15 October 2026 · Initiative Remswelle